class: left, bottom, title-slide, inverse .gray[Data Visualization Show & Tell] # B2 .gray[(.strike[English level])] ## Bridging .text-highlight[Code] and .text-highlight[Interactive Visualization] in Computational .text-highlight[Notebooks] Yifan Wu, Joseph M. Hellerstein, Arvind Satyanarayan (UIST 2020) --- class: inverse # .over[What is this paper about?] 🤔 ## TL;DR B2 is a set of ideas and an extension for Jupyter Notebook to improve the .text-highlight[data analysis workflow] considering interactive charts and their reproducibility/display. -- In other words, how can .text-highlight[interactive charts] be leveraged on notebooks? -- ## Keywords (Exploratory) Data Analysis -- .pull-left[ - Data Visualization - Vega-Lite ] -- .pull-right[ - Literate programming - Jupyter Notebook ] --- class: inverse # .over[How is it structured?] 🗂 1. Introduction 2. B2 demo (case study style) 3. Related work 4. *Theoretical* considerations 5. System design and implementation 6. Evaluation - First-use study w/ 7 participants (low number due to COVID-19) - *Metrified* notebook and qualitative feedback 7. Conclusion --- class: middle center inverse 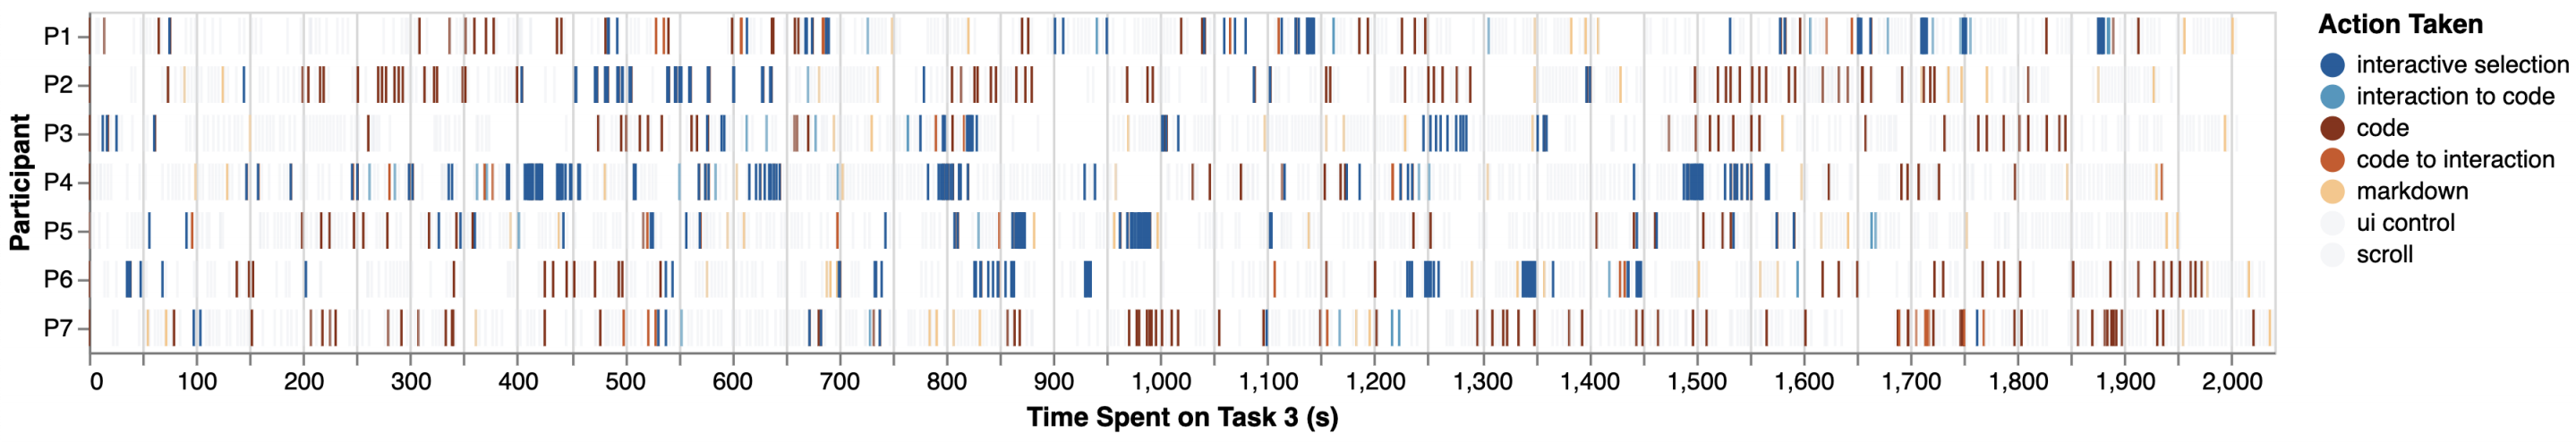 Participants' interaction traces while working on one of the tasks. --- class: inverse # .over[Entry point] ⛩ ## Isolation "Currently, although (...) [code cells and visualizations] may be interleaved, they remain .text-highlight[siloed]: interactive visualizations must be manually specified as they are divorced from the analysis provenance expressed via data frames, while code cells have no access to users' interactions with visualizations (...)." -- ## Shared representation "The fundamental task of data analysis involves .text-highlight[iterative data transformation], and both code [via data frame manipulations] and interactive visualizations [via interactive selections] can capture this task as a data query." -- In this paper, "interactive selections" are based on Vega-Lite's .text-highlight[*selections*]. They map user input (like a mouse click) into data queries, which can subsequently be used to filter data points, for example. --- class: inverse # .over[The three gaps] 🚧 ## Semantic gap This gap "(...) prevents each side [code cells and visualizations] from understanding the work that is happening in the other;" "(...) an analyst must manually construct appropriate interactive visualizations from scratch even if the code that specifies the data frame captures semantics that can automate visualization design." --- class: inverse # .over[The three gaps] 🚧 ## Semantic gap This gap "(...) prevents each side [code cells and visualizations] from .text-highlight[understanding the work] that is happening in the other;" ## Temporal gap This gap "(...) allows only code to .text-highlight[persist], and only interactions on visualizations to be .text-highlight[transient];" -- ## Layout gap This gap occurs "(...) between the notebook's .text-highlight[linear] structure and rich coordinated .text-highlight[multi-view visualizations]." --- class: inverse # .over[Key features] 🚑 - .text-highlight[Dashboard panel] - The charts are displayed on a dashboard located to the right of the notebook in order to facilitate (interactive) multi-view displays (regardless of the source cell). -- - .text-highlight[Interaction log] - Interactive selections are represented by their underlying predicate definitions in code cells. -- - .text-highlight[Reactive cells] - Cells marked as *reactive* (via the `%%reactive` IPython magic command) are automatically recomputed when new interactions occur. -- - .text-highlight[*Auto plotting*] - Charts can be *inferred* from a data frame or from the list of columns available on the dashboard (heuristic-based). - If two data frames derive from the same data frame, the generated charts will be linked. --- class: inverse # .over[*Intermediate* remarks] 🚀 ## Placing Data Visualization in the workflow "(...) we should work on standardized data .text-highlight[interfaces for visualization for both input and output data]. Input data is defined as the data used for the visualization. Output data is defined as data created by interacting with the visualization (e.g., selections, filtering)." (Schmidt & Ortner, 2020) -- ## Leveraging Data Visualization *in practice* In practice, it is sometimes easier and faster to manipulate a data frame, draw some conclusions, and proceed with the analysis — instead of creating and using a chart. This approximation of charts to data manipulation seems, at least at first glance, to invite the user to plot data. --- class: middle center inverse # .text-highlight[Demo!] ## .strike[😈] 📓 📊